
Insert a Bar Charts gadget into a dashboard
-
Go to Dashboards
-
Create a new dashboard or edit an existing dashboard.
-
Click on “Add gadget” and search for “Bar Chart”:
-
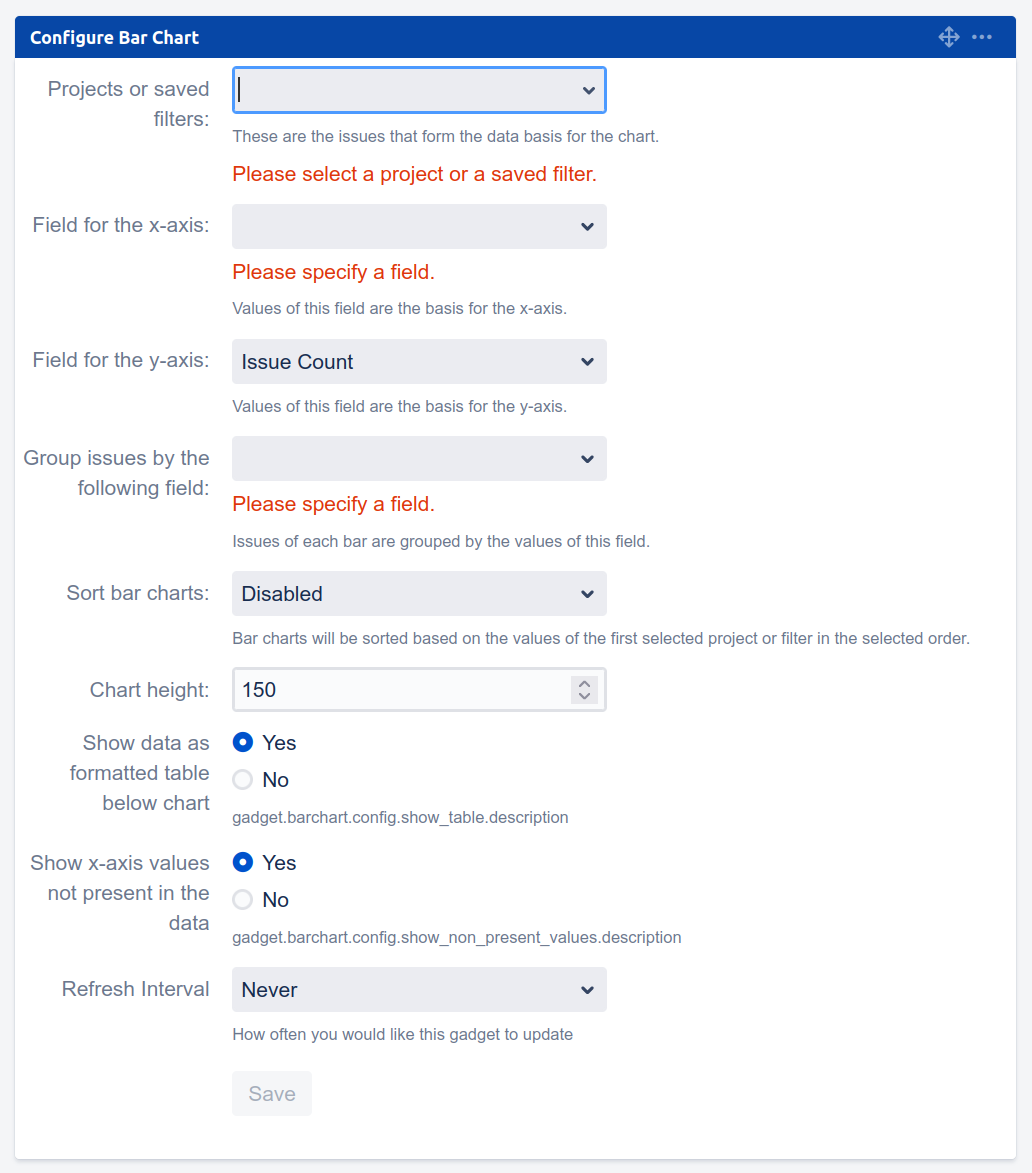
Click on “Add gadget” to add the gadget to the dashboard. The gadget will show the configuration screen:
-
Configure the gadget. You must at least specify a project or saved filter, a field for the x-axis and a field for grouping.
-
Click “Save” to insert the Bar Charts gadget.