Show non-present values
Show non-present values
Create a new Bar Charts gadget or edit an existing Bar Charts gadget in your dashboard.
Go to Advanced Setting tab, choose the “Show x-axis values not present in the data” option:
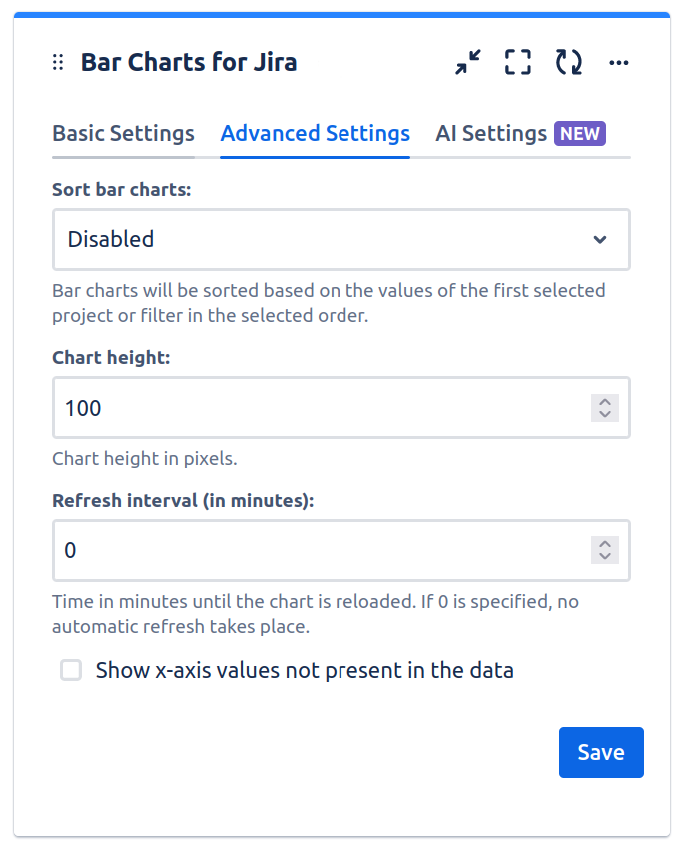
Click “Save” to save the Bar Charts gadget.
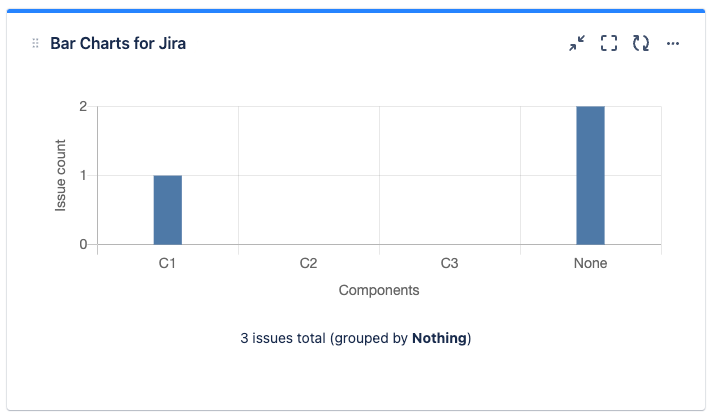
The chart will also show non-present values, which are values that are currently not present in the set of issues that forms the data basis for the chart: