Show data as formatted table below chart
-
Create a new Bar Charts gadget or edit an existing Bar Charts gadget in your dashboard.
-
In Basic Settings, choose the “Show data as formatted table below chart” option:

-
Click “Save” to save the Bar Charts gadget.
-
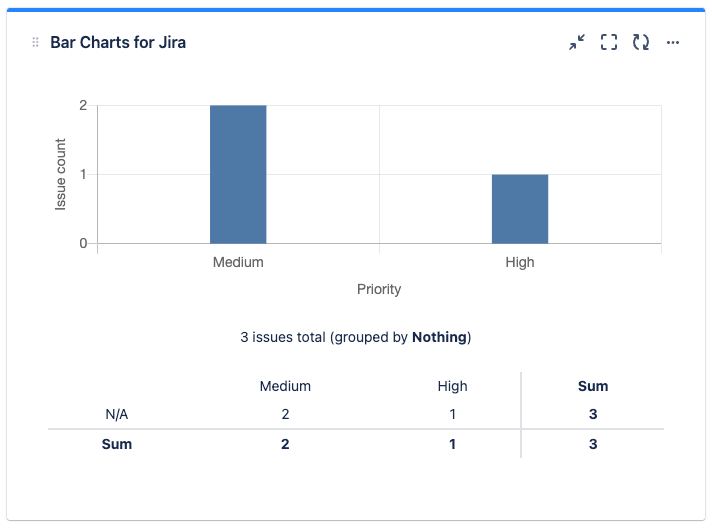
A data table will be shown below the chart: