Access survey engagement and responses
Survey manager can view a survey’s pending, finished and eligible participants. With that information they are able to analyze the survey engagement, send reminder emails and vie responses of participants.
Survey Engagement
In “Anonymous” mode, survey managers cannot view individual participant responses. They are only able to see responses on a survey-wide level.
Click on “Pending participants”, “Finished participants” or “Eligible participants” the see an overview of the corresponding participants.

You can search for participants in the search bar
If you click on “Filter Participants” you can hide participants who are no longer eligible to respond by clicking on the toggle

Send an email reminder
Due to technical limitations in the Atlassian cloud, clicking the “Send reminder email” button has no effect. Instead, hold the Ctrl/⌘-Key and click on the “Send reminder email” button to create a new reminder email in your default email client. The email draft contains all currently filtered participants. If there are Survey participants without a visible email address, you will be informed about that through a warning icon next to the “Send reminder email” button.
Depending on the number of Survey participants, your email client, your browser, and your operating system, it may occur that the reminder email will not open automatically. In this case, please download the list of email addresses directly as a comma-separated-value (CSV) file using the drop down button, see screenshot below. Open the CSV file in a standard text editor. Then you can then paste them into the address line of your email client. Be aware, that in some cases mail clients have a limit for the number of recipients which may be exceeded.

View responses
You can’t see participants' responses in anonymous surveys
Click on “View” to see the participant’s answer.

Download responses
You can download all responses in CSV or Excel format by clicking on “Download responses” and selecting the format.

Analyze responses
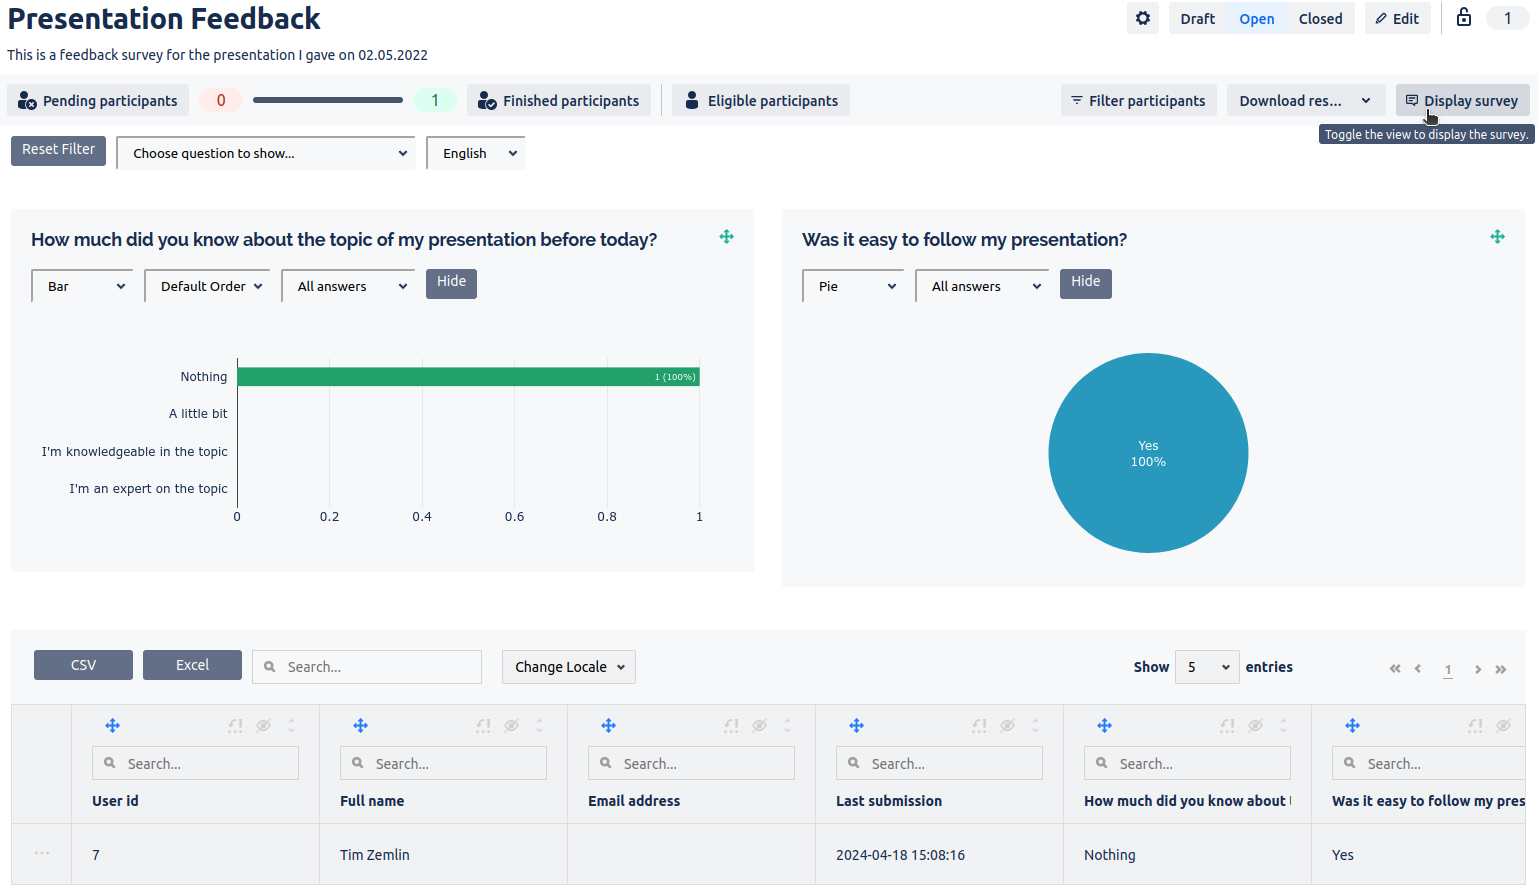
See a number of different analysis charts regarding the responses for each question.
Click on “Display survey” and customize your visualization

