
1 Basics of troubleshooting the app migration
A migration usually happens in multiple phases.
-
In the first phase, Atlassian entities like projects, filters and dashboards are migrated. This part is handled completely by Atlassian. Bar Charts gadgets on dashboards are not migrated, yet.
-
In the second phase (export step), app data of the Bar Charts gadgets on previously migrated dashboards is collected on the Jira Data Center instance and sent to the Jira Cloud instance. The data is then temporarily stored on the Cloud instance. A success of this phase is shown in the details view for the migration of the Atlassian Cloud Migration Assistant.

-
In the third phase (import step), the stored app migration data on the Cloud site is used to create Bar Charts gadgets on the Cloud site. The state of this phase can be seen on the app’s migration assistant page (“Apps” → “Bar Charts for Jira” → “Resources” → “Admin Settings” → “Cloud Migration Assistant”).
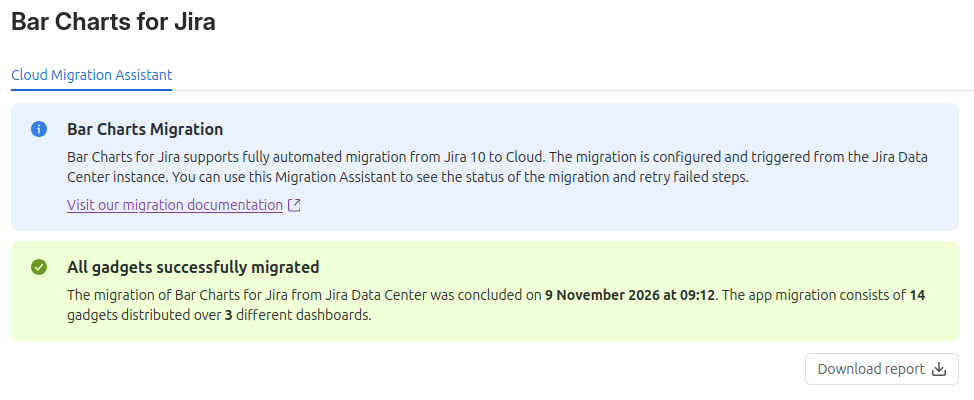
For the administrator starting the migration, the entire migration with all of its phases can be triggered in one go. But for analysing problems, it might be important to know in which phase the failure happened.
1.1 App migration progress logs
You can download the app migration progress logs in the migration details view on the Data Center instance once the export of app data into to the Cloud has concluded. They offer detailed insights into the export step during the Data Center Migration. In case of export problems, they also provide a list of problematic dashboards and gadgets as well as the root cause.
1.2 Apps own Migration Assistant page
The Migration Assistant of Bar Charts for Jira is a UI for Jira Cloud administrators to check the success or failure of the app migration. It can be found in “Apps” → “Bar Charts for Jira” → “Resources” → “Admin settings” → “Cloud Migration Assistant”.
It displays a migration status panel. Once a migration is concluded, it provides a button for downloading our migration report.
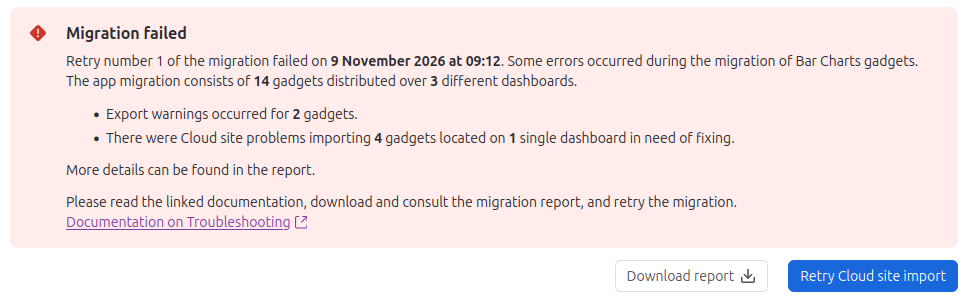
If the app migration failed trying to generate gadgets on the Cloud site (= import step), the Migration Assistant page provides a retry button for retrying the import of the failed gadgets without having to restart the entire app migration.
1.2.1 Migration report
The migration report is a human readable description containing information about errors and warnings that occurred during the app migration.
1.2.2 “Retry Cloud site import” button
The retry button retries exactly the parts of the third phase that are listed in the migration report as failed. Clicking the retry button should not result in duplicates or the property of gadgets that have already been successfully migrated being overwritten.
1.3 New migration
When a new migration is triggered from Jira Data Center, all the temporary app data from the last migration including the retry data is deleted. Bar Charts gadgets created through a previous migration are updated by the new migration unless they have been altered by a user in the meantime. If a user has changed a migrated gadget, then a subsequent migration will create a new gadget alongside the user edited one.
1.4 Verifying the success of a Bar Charts app migration
To check for a successful app migration:
-
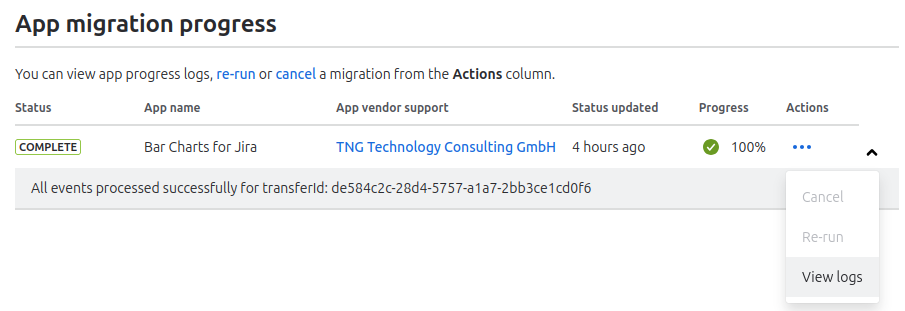
On the Data Center instance, check the status of the app migration in the details view of the migration. It should show status “Progress” “100%” and “Status” “Complete”.

-
For additional information you can click on the the dots below “Actions” and “View logs” to download the Progress logs of the export step of the app migration.
-
-
On the Cloud instance, check the app’s own Migration Assistant page. Check the date and the state of the migration. If the date matches the date of the current migration and the state is success, then you can continue to check the gadgets. An old date indicates that the import step of the current migration hasn’t started yet.
-
When the migration is concluded (either successful or failed), you can download the app’s Migration Report. It provides you with a detailed account of the everything unusual that might have occurred during the migration.
-
-
On the Cloud instance, you can manually check migrated dashboards with migrated gadgets. Do they work as expected or is something missing or different?
2 Known issues and how to fix them
2.1 Timeout of App Migration Progress
If the app migration progress of Bar Charts for Jira shows the status “TIMED OUT”, the most likely root cause is that the Cloud instances uses an outdated version of the app.
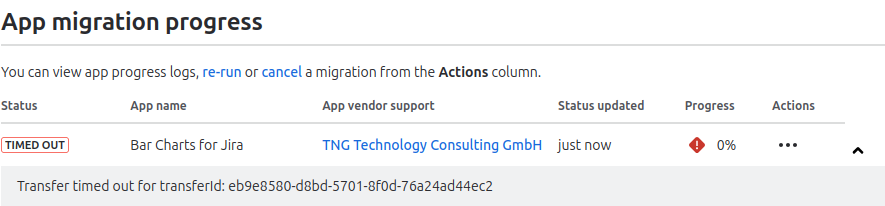
Please check the minimum version requirements noted in the prerequisites section of our migration walkthrough and update the app accordingly. For details on updating apps see https://confluence.atlassian.com/upm/updating-apps-273875710.html.
Other possible root causes might be connection problems between the Data Center instance and the Atlassian Cloud.
If both of these cases don’t apply, please don’t hesitate to contact us.
2.2 Export issues
There is a variety of possible issues that we summarize under the term “export warning” and more general “export issue”. Export issue often means that a gadget is configured in a way that it wouldn’t work on the Cloud site after the migration as it does on the Data Center site. For example a Bar Charts gadget to be migrated might use a project that isn’t part of the migration. Export warnings are mentioned on the migration status page in the app’s migration assistant.
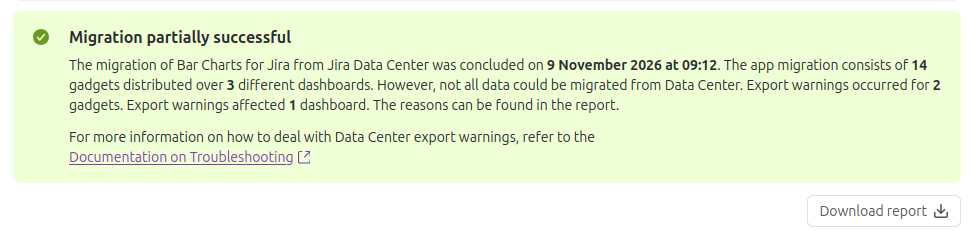
Export issues are not blocking. However, it might be prudent to take a look at them and see if they are harmless or indicate a bigger problem with the migration. The purpose of export issues is to indicate that there is something unsound with the configuration of those gadgets that are supposed to be part of the migration. As a result, a gadget might be skipped during migration or the migrated gadget on Cloud site might be slightly differently configured than the original gadget on Data Center site.
In general these export issues include:
-
INFO: gadgets with an incomplete configuration
Effect: Nothing. The configuration of the migrated gadget on the Cloud will just be as incomplete as the one of the gadget on the Data Center instance. -
INFO: gadgets with an incorrect configuration
Effect: For the migrated gadget on the Cloud instance, the incorrect part of its configuration is either removed or replaced by a suitable default value. -
WARNING: gadgets with references to entities that are not part of the migration,
e.g. the Bar Charts gadget might reference a project, filter or custom field that is not migrated;
Effect: The reference is removed from the configuration of the migrated gadget on the Cloud instance. -
WARNING: inability of the app migration to access certain configuration of gadgets;
Effect: A specific gadget or all the Bar Chart gadgets on a dashboard might be omitted from the migration.
You can find information about export issues in the Migration Report and the Progress logs.
Reports about export issues contain the ID of the dashboard and/or gadget for which the problem occurred as well as a description of what happened. To get rid of export issues, you have to fix the underlying problem and then re-run the app migration from the Data Center site. But usually issues refer to minor problems that don’t warrant a re-run of the migration.
2.3 “Migration failed” status in the Migration Assistant on the Cloud site
There are multiple reasons that can cause an error with the app migration. Once the root cause has been removed, the failed status can be resolved by clicking on the retry button.
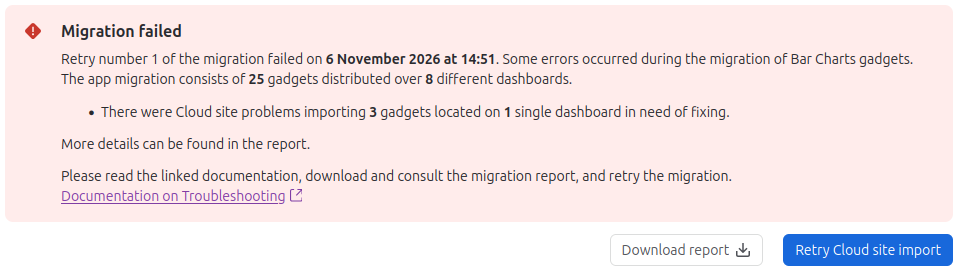
If the the migration fails for the gadgets on one or multiple dashboards, you can do the following steps to check the most probable root causes.
-
Get the id of the affected dashboard from the migration report.
-
Check if the dashboard is still there on the Cloud instance and has not been deleted.
-
Check that the permissions for the dashboard are valid.
The most likely root causes for a “Migration failed” status are as follows.
2.3.1 Dashboard has been deleted on the Cloud instance
A dashboard and the gadgets on the dashboard are not migrated simultaneously. In fact there can be quite some time in between. The migration of third party apps including the migration of Bar Charts for Jira is usually the last step of a migration from Data Center to Cloud. If a dashboard is deleted before the Bar Charts gadgets are migrated, the migration fails and the Migration assistant shows “Migration failed”.
Resolution
The migration report gives you the IDs of the dashboards for which the migration failed. Check if the dashboard with a given ID is still active or if it has been moved to the trash. Administrators can find dashboards that have been moved to the trash on the “Manage dashboards” page in the Jira admin settings. You find it in “Settings” → “System“ → “Dashboards”.
See also next section on “Invisible dashboards”.
If the dashboard has been restored from the trash, the retry of the migration should succeed.
2.3.2 Invalid dashboard permissions on the Cloud instance
Sometimes dashboards have invalid permissions after being migrated. This can happen if an entity that has a permission for the dashboard, e.g. a user or a project, is not migrated. See the screenshot below for an example, in which view permissions for the dashboard are assigned to “Unknown project”. In this case it was a project that existed on the Data Center instance but wasn’t migrated to Cloud.
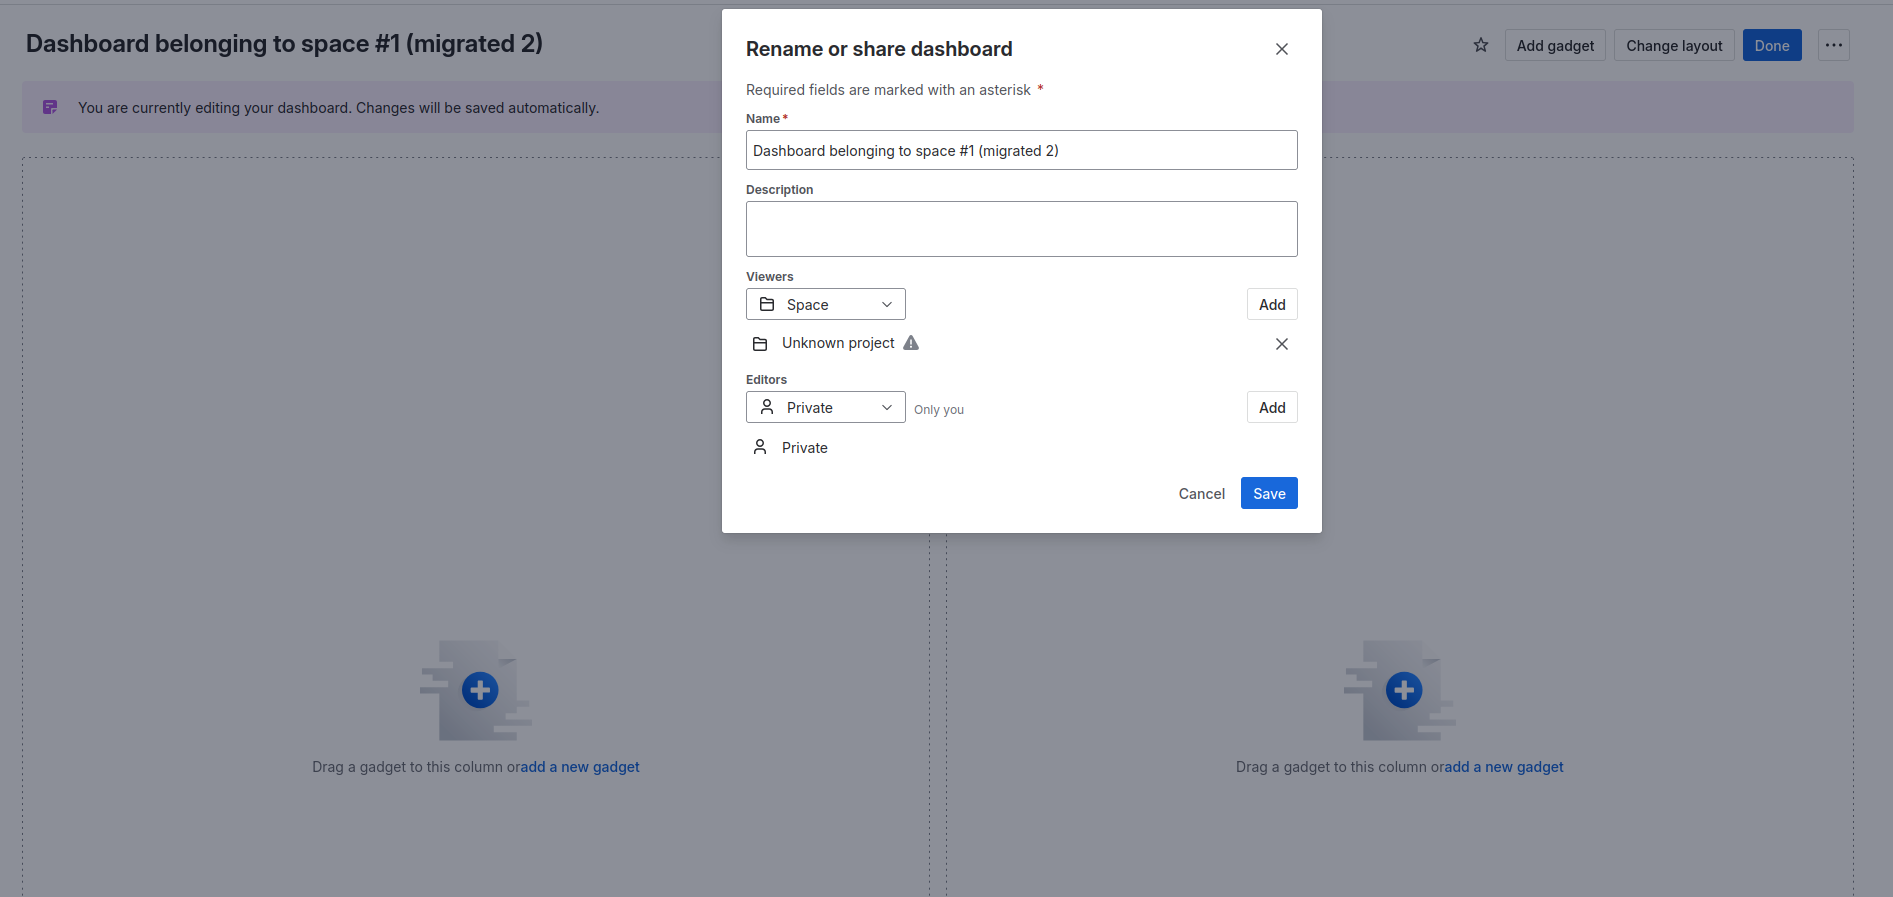
Migrating gadgets to a dashboard that has invalid permissions will fail. It does not matter if these are invalid Editors or invalid Viewers.
Resolution
The migration report gives you the ID of the dashboards for which the migration failed. The easiest way to resolve this is to remove the invalid permissions from the affected dashboards on the Cloud site. This can be done by editing the dashboard, clicking on “Rename or share”, and then saving with the invalid permissions having been removed.
Afterwards, the retry of the migration should work. However, you might want to look into the cause of the invalid permissions since they might be an indicator for more general problems with the migration.
2.4 Invisible dashboards
Sometimes users notice that dashboards are not visible after a migration. The most common reason is that a user and/or their permissions were not mapped correctly from Data Center to Cloud. Hence, the user lacks the permission to see the migrated dashboard on the Cloud instance.
If you cannot see the migrated dashboards, an administrator can check if they have been migrated and adjust the permissions. To check that open “Settings” → “System” from the top right corner
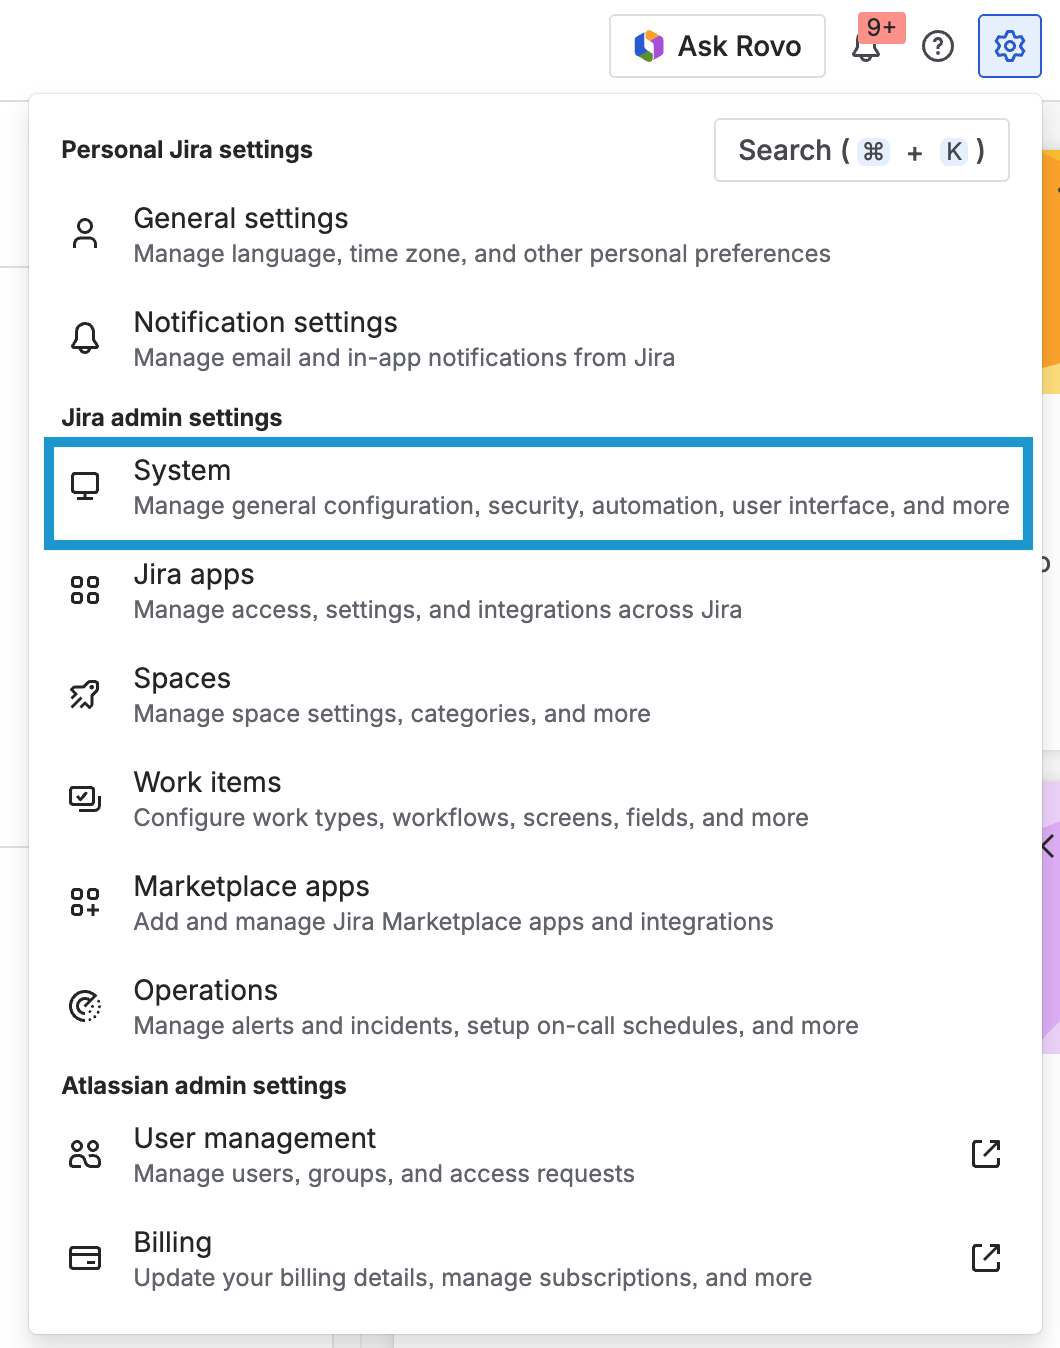
then open “Dashboards” and search for the migrated ones. If you find them, make sure that the permissions for the visibility of the dashboards are configured correctly.
2.5 Bar Chart gadgets don’t show expected statistics
Sometimes the app migration is reported as successful, but Bar Chart gadgets show different statistics on the Cloud instance than they did on the Data Center instance. The root cause is usually an issue caused by stale DC-to-Cloud mappings for projects or filters used as the data basis of the gadget and often not an issue with the Bar Charts app itself.
Resolution
When a migrated Bar Chart gadget doesn’t show the statistics you expect in the Cloud instance, check the projects, filters and custom fields referenced by the gadget.
3 Still having problems?
If you have further questions or problems, please open a support request.
We recommend to activate logging of Bar Charts for Jira for the duration of the migration. Logging can be activated at “⚙️” → “System” → “Logging and profiling”.
In the Section “Default Loggers” click on “Configure”, set “Package name” to com.tngtech and “Logging Level” to DEBUG and click “Add”.
You may deactivate logging for com.tngtech after the migration is concluded.