
The AI features need to be enabled by an administrator to be available to users.
Generating AI-powered Insights with 
Rovo
You can use Atlassian’s chatbot Rovo to analyse the data in bar charts.
Follow these steps:
-
Navigate to the dashboard page that contains your Bar Charts for Jira gadget.
-
If you edit the page or the gadget, remember to click ‘Done’

-
Click on the ‘Ask Rovo’
-
In the newly opened panel, do the following:
-
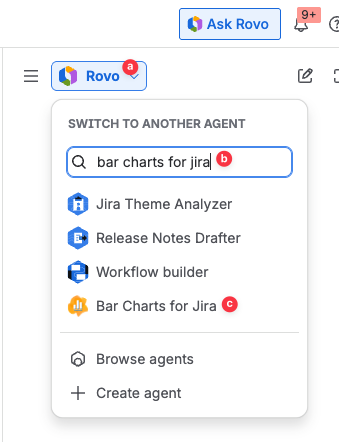
Click on the dropdown menu at the top that allows to ‘switch to another agent’.
-
Type ‘bar charts’ in the ‘Search agents’ box
-
Select the ‘Bar Charts for Jira’ agent.
-
-
Submit a prompt for Rovo. Either click on one of the stock prompts displayed in the middle of the panel, or type a custom prompt into the text box at the bottom of the panel. The prompt can request analysis of only one specific chart or request analysis of multiple charts simultaneously.
-
After a pause for model inference, chatbot output text will be presented in the Rovo side panel.
-
Continue submitting and refining prompts to gain insights into the data.