
Interact with a bar chart by hovering over bars or clicking on the elements in the chart legend.
Instructions
-
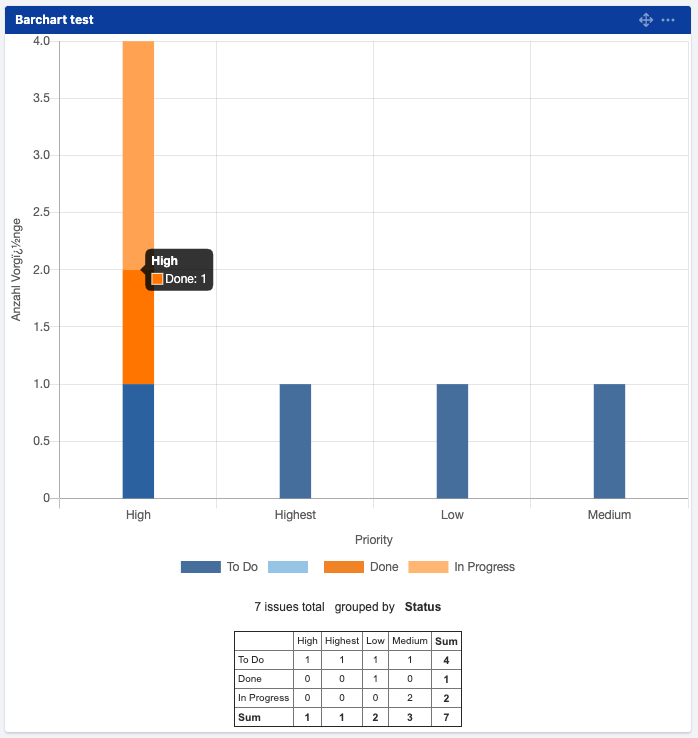
Open a dashboard with a bar chart gadget. Hover over a bar to see the issue count for the hovered element.
-
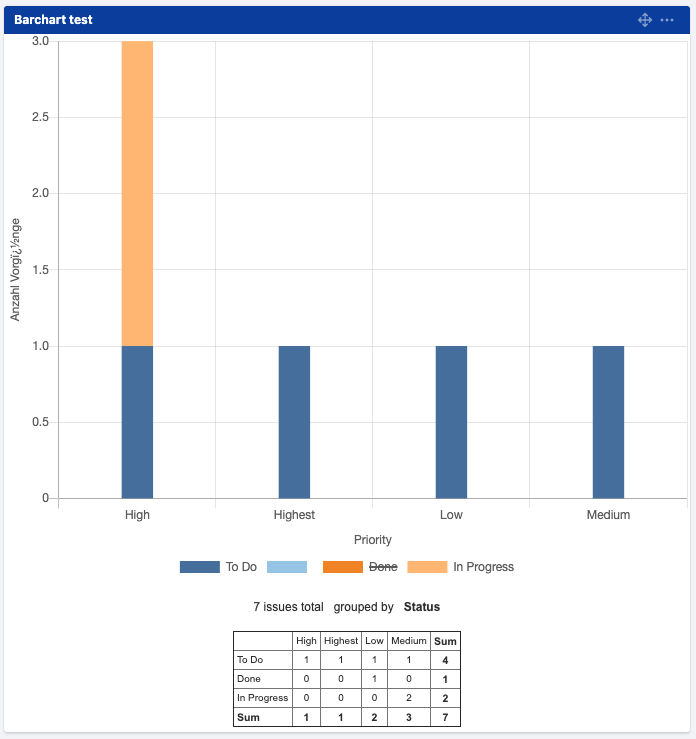
Alternatively, click on one of the elements in the chart legend to temporarily exclude the respective issues from the chart.
-
Congratulations! 🎉 You have successfully interacted with a bar chart.