Display a simple chart in your dashboard
-
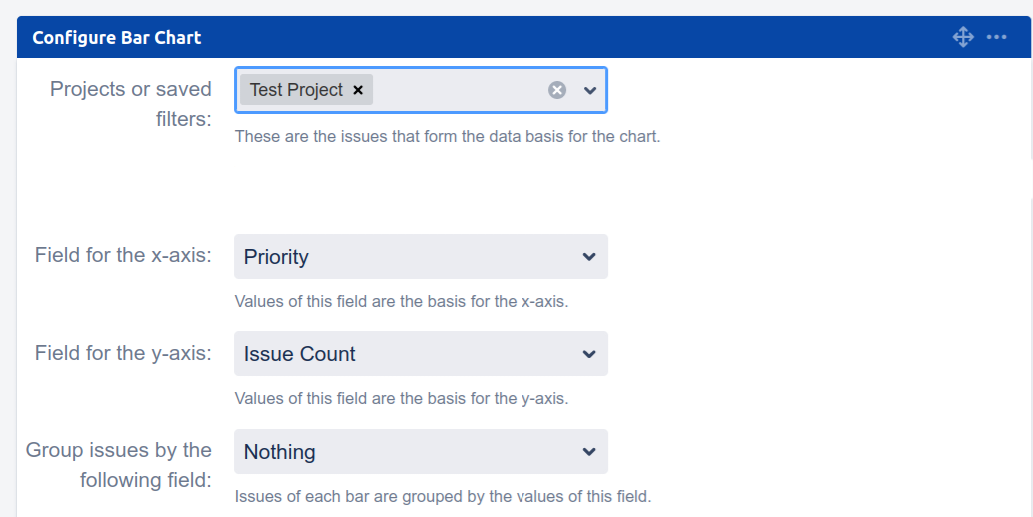
Create a new Bar Charts gadget or edit an existing Bar Charts gadget in your dashboard.
-
Specify a project or saved filter, select a field for the x-axis and select “Nothing” for grouping:
-
Click “Save” to save the Bar Charts gadget.
-
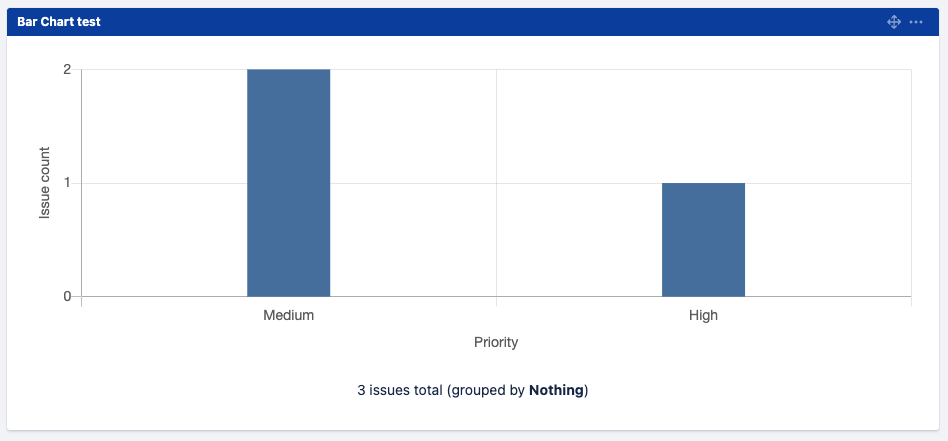
A simple chart will be shown: